 Popular resources


![]() What's it?
What's it?
Large-scale efforts for parallel acquisition of multiomics profiling continue to generate extensive amounts ofmulti-dimensional biomedical data. Thus, integrated clustering of multiple types of omics data is essential for developing individual-based treatments and precision medicine. However, while rapid progress has been made, methods for integrated clustering are lacking an intuitive web interface that facilitates the biomedical researchers without sufficient programming skills. Here, we present a web tool, named Integrated Clustering of Multidimensional biomedical data (ICM), that provides an interface from which to fuse, cluster and visualize multi-dimensional biomedical data and knowledge. With ICM, users can explore the heterogeneity of a disease or a biological process by identifying subgroups of patients. The results obtained can then be interactively modified by using an intuitive user interface. Researchers can also exchange the results from ICM with collaborators via a web link containing a Project ID number that will directly pull up the analysis results being shared. ICM also support incremental clustering that allows users to add new sample data into the data of a previous study to obtain a clustering result. Currently, the ICM web server is available with no login requirement and at no cost at http://biotech.bmi.ac.cn/icm/.
![]() How to use it?
How to use it?
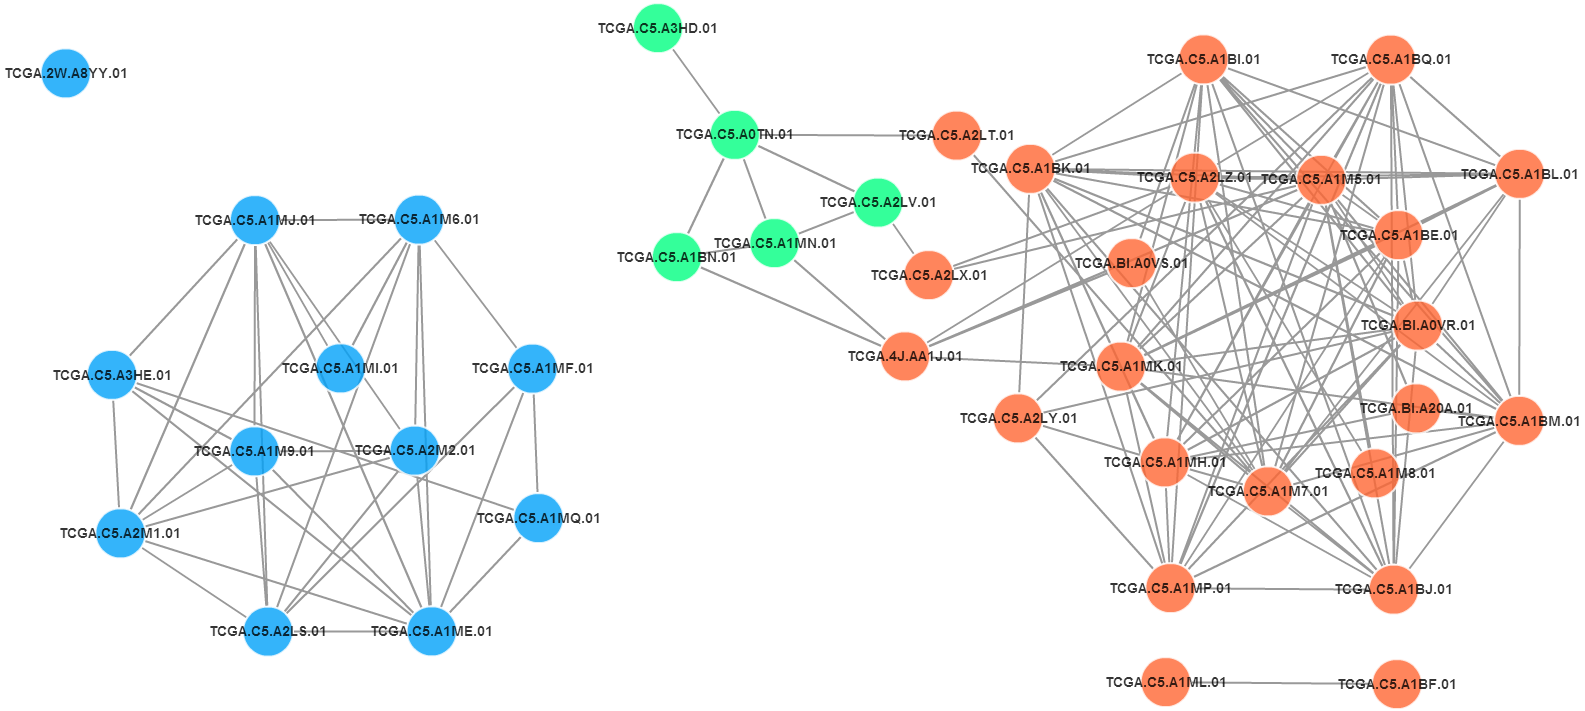
In the web page of ‘Input Data’, you can upload your multidimensional types of measurements for a set of samples. The other information (such as the clinical information of patient samples) about samples is optional. If you upload the sample information, you could click the sample node in network to view the detail informations about samples. You can view ,preprocess and check the input data in real time in the format of tables and heatmaps. After checking the input data, you could click the button named‘submit’to submit your input data. After that, the web page turn to ‘Similarity Network Fusion’. In the web page of ‘Similarity Network Fusion’, you could set 4 parameters of the SNF algorithm. Before you click the button ‘Run’, you should fill your email in the corresponding blank to get the calculation result. After that, click ‘Run’to run the SNF algorithm. While the calculation may take a few minutes, you will get a unique project-ID and Link, only by which you could view the result of your project. And only by the unqieu project-ID, can you do the latter‘New Group Predict’calculation. In the‘Result’ panel of the ‘Similarity Network Fusion’page, you can view the main clustering result in the format of table, heatmap and network. You can switch the similarity network of result and each measurement, viewing and modifing the network interactively. We calculate the important rank of features in different data type, which is shown in the‘Feature’page. The big heatmap of important features for a set of clustering subtype samples can be viewed in the right panel in the ‘Feature’page. The picture and result data in detail are avaliable for downloading. In the web page of ‘New Group Predict’, you should fill your previous project-ID in the corresponding blank first. Then you can upload the same types of measurements for a new set of samples. In each data type, the measurement should be consistent with the previous input data correspondingly. The name, type, log2 transformation and normalization of each data should be the same as the previous input data. The information about new samples is optional as well. After setting the parameters as the web page of ‘Similarity Network Fusion’, click ‘Run’and the result will show in the format of network and table as well. The picture and result data in detail are avaliable for downloading.
![]() Institute
Institute
Academy of Military Medical Sciences (军事医学科学院)
![]() Author
Author
Song He (何松),Haochen He (贺浩宸),Fei Li (李非),Xiaochen Bo(伯晓晨)
![]() Support
Support
![]() Publication
Publication
![]() Figure
Figure
![]() Funding source
Funding source
[{"id":"1","name":"CNHPP int'l project 3:2014DFB30020(中国人类蛋白质组学数据的知识发现)"}]